
引用本文

. 数据资讯:2015—2019年中国科技投入与产出概况. 中国科学院院刊, 2021, 36(1): 118-121

数据资讯:2015—2019年中国科技投入与产出概况
随着科学技术的迅猛发展及其对经济社会发展影响的日益增强,人们对国家科技发展的关注程度不断提高。把握国家科学技术发展的宏观数据与态势,目前已成为科技战略和科技政策制定及科研活动本身需要关注的重要内容。本文从人员投入量、经费数额与来源、科技产出、专利申请与授权、高技术产品进出口额等方面,梳理了2015—2019年中国科技投入与产出的相关数据,以期为科技战略决策提供第一手的数据参考资料。
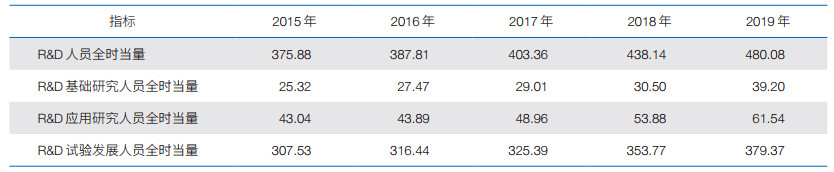
1 研究与试验发展人员投入情况
表 1 2015—2019年中国研究与试验发展(R & D)人员全时当量概况(单位:万人年)
Table 1 Overview of full time equivalent of China's research and experimental development (R & D) personnel from 2015 to 2019
|

|
| 图 1 2015—2019年中国3类研究与试验发展(R & D)人员在R & D总人员中的占比情况 Figure 1 Proportion of three types of research and experimental development (R & D) personnel in total R & D personnel in China from 2015 to 2019 |
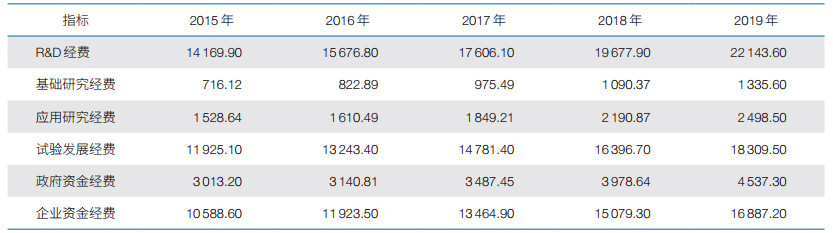
表 2 2015—2019年中国研究与试验发展(R & D)经费概况(单位:亿元人民币)
Table 2 Overview of China's research and experimental development (R & D) founds from 2015 to 2019
|

|
| 图 2 2015—2019年中国研究与试验发展(R & D)经费在当年国内生产总值(GDP)的占比情况 Figure 2 Proportion of research and experimental development (R & D) expenditure in gross domestic product (GDP) from 2015 to 2019 |

|
| 图 3 2015—2019年中国3类研究与试验发展(R & D)经费在R & D总经费中的占比情况 Figure 3 Proportion of three types of research and experimental development (R & D) funds in total R & D funds in China from 2015 to 2019 |

|
| 图 4 2015—2019年中国研究与试验发展(R & D)总经费中政府资金与企业资金的经费占比情况 Figure 4 Proportion of government funds and enterprise funds in China's total research and experimental development (R & D) funds from 2015 to 2019 |

|
| 图 5 2015—2019年中国专利与发明专利的申请数量(单位:项) Figure 5 Application of patents and invention patents in China from 2015 to 2019 |

|
| 图 6 2015—2019年中国专利和发明专利的授权数量(单位:项) Figure 6 Grant of patents and invention patents in China from 2015 to 2019 |

|
| 图 7 2015—2019年中国高技术产品进出口额(单位:亿美元) Figure 7 Overview of China's high-tech products import and export from 2015 to 2019(in 108 US dollars) |
(本文图表数据根据中国政府网、国家统计局官方数据进行相关整理和计算得到,作者:文彦杰,张帆,武一男,金杭川)