数据资讯:全球热点城市科技创新能力比较(2016—2020年)
“在新一轮科技革命和产业变革大势中,科技创新作为提高社会生产力、提升国际竞争力、增强综合国力、保障国家安全的战略支撑,必须摆在国家发展全局的核心位置。”“当今世界,谁牵住了科技创新这个‘牛鼻子’,谁走好了科技创新这步先手棋,谁就能占领先机、赢得优势。”①
① 习近平关于科技创新论述摘编. [2016-02-27]. http://www.xinhuanet.com/politics/2016-02/27/c128754760.htm.
城市是国家创新活动的主体区域,科技创新能力是保持和增强城市竞争力的核心能力,更重要的是,提高城市创新能力也是完善国家创新体系、实施创新驱动发展战略、建设创新型国家的重要方面。鉴于此,本文选取20个全球重要创新城市,介绍其创新人才、研究论文产出、优势研究领域、创新型公司、商业研究方面情况,以期为决策者更好地发掘我国城市科技创新竞争力,制定相关科技创新城市的发展策略提供数据支撑。
1 创新人才
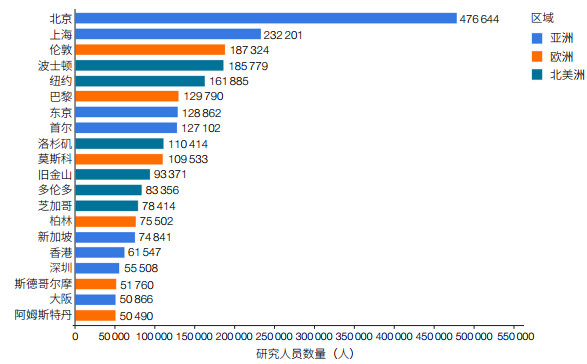
|
| 图 1 全球20个城市研究人员数量(2016—2020年) Figure 1 Number of researcher of 20 global cities (2016–2020) |
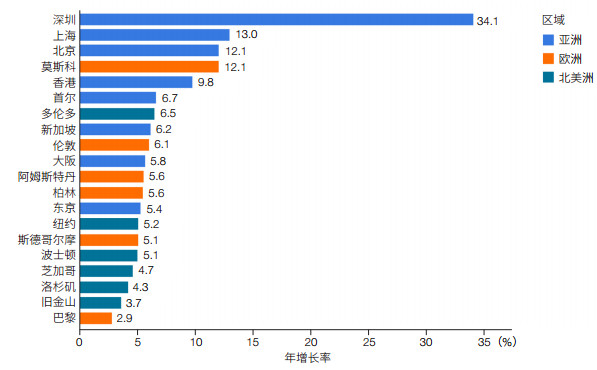
|
| 图 2 全球20个城市研究人员数量年增长率(2016—2020年) Figure 2 Compound annual growth rate (CAGR) of number of researchers (2016–2020) |
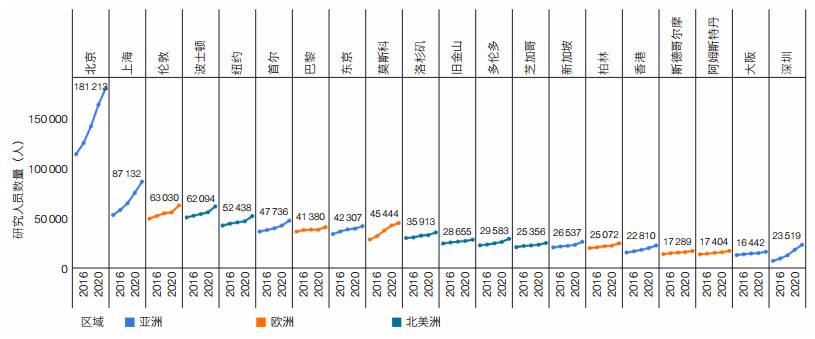
|
| 图 3 全球20个城市的研究人员数量年度变化情况(2016—2020年) Figure 3 Trend of researchers from 20 global cities (2016–2020) 标签标示的人数为2020年研究人员数量 Numbers are data in 2020 |
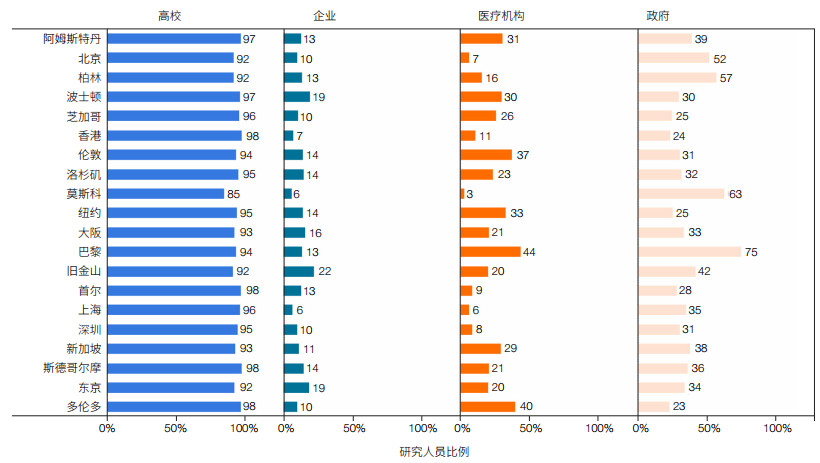
|
| 图 4 全球20个城市研究人员在高校、企业、医疗机构、政府的分布情况(2016—2020年) Figure 4 Distribution of researchers by sector for 20 global cities (2016–2020) 本报告统计的研究人员根据其工作类型分为5个来源部门——高校、政府、企业、医疗机构和其他,且根据Scopus论文作者署名单位,1位研究人员可能会来自多个来源部门;本图只显示来自高校、政府、企业、医疗机构的研究人员比例,略去来自“其他”部门的情况 The researchers counted in this report can be divided into five sectors according to their type of affiliation: higher education, government, corporate, medical, and others. According to the authorship of Scopus paper, one researcher might come from multiple sectors. This figure only shows the distribution of researchers from higher education, government, corporate, medical sectors, omitting the situation from scenario "other" departments sector |
|
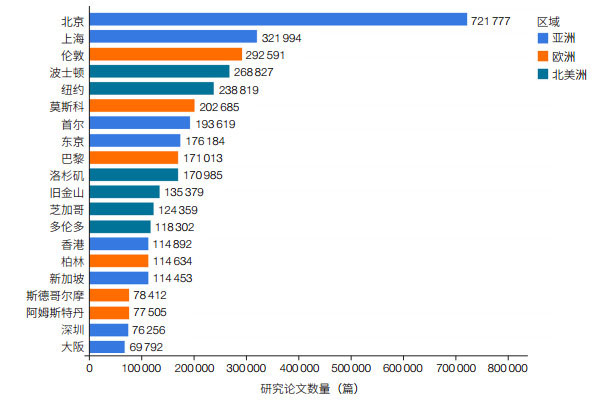
| 图 5 全球20个城市研究论文产出数量(2016—2020年) Figure 5 Count of scholarly output for 20 global cities (2016–2020) |
|
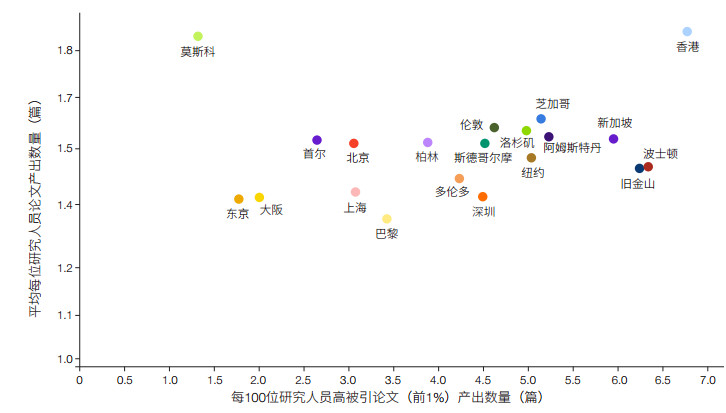
| 图 6 全球20个城市研究人员人均论文产出数量及每百人高被引论文(前1%)产出数量(2016—2020年) Figure 6 Number of publications per researcher and number of top 1% highly cited publications per 100 researchers for 20 global cities (2016–2020) |
|
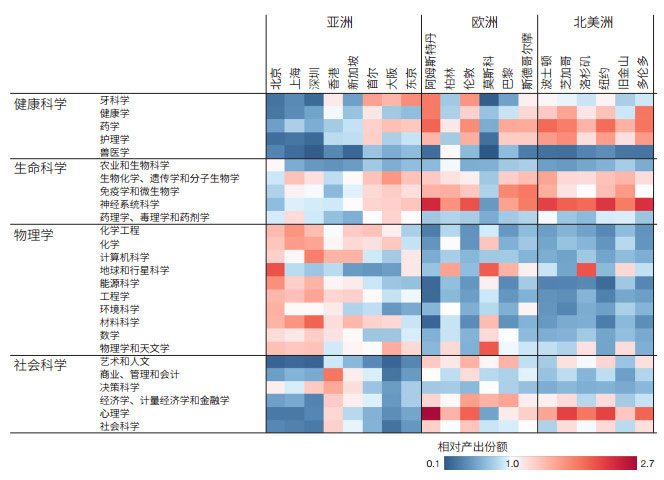
图 7 全球20个城市的研究领域相对产出份额(2016—2020年)
Figure 7 Relative output share by subject for 20 global cities (2016–2020)
 ,相对研究产出份额大于1表示该城市专注于该研究主题 ,相对研究产出份额大于1表示该城市专注于该研究主题
 . If the "relative output share"is over 1.0 in a subject, it means the city is comparatively focused on this subject. . If the "relative output share"is over 1.0 in a subject, it means the city is comparatively focused on this subject.
|
|
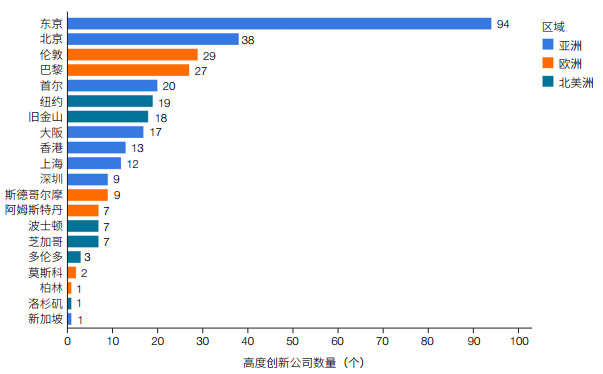
| 图 8 全球20个城市的高度创新公司数量(2018年/2019年) Figure 8 Number of highly innovative companies for 20 global cities (2018/2019) |
|
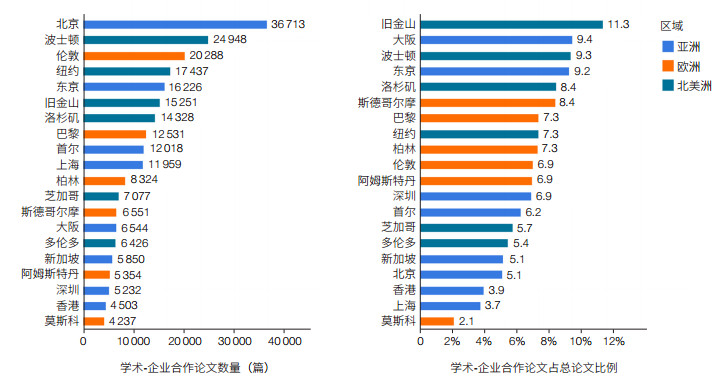
| 图 9 全球20个城市的学术-企业合作论文数量和学术-企业合作论文份额(2016—2020年) Figure 9 Number of academic-corporate collaborated publications and the share of academic-corporate collaborated publications for 20 global cities (2016–2020) |
|
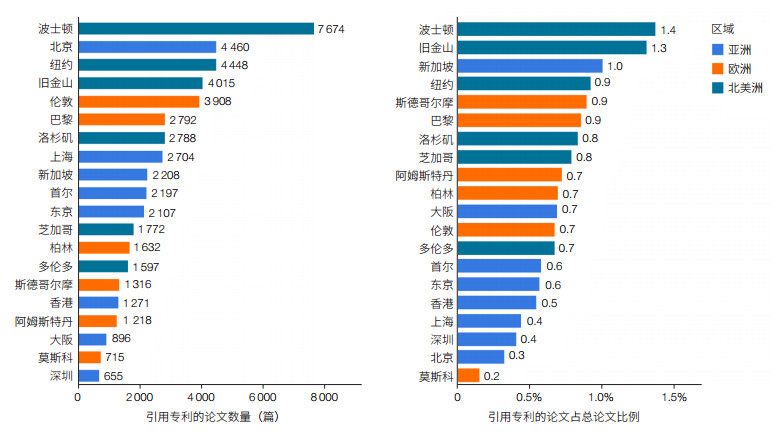
| 图 10 全球20个城市的引用专利的论文数量和引用专利的论文占总论文比例(2016—2020年) Figure 10 Citing-patent publications and percentage of publications citing patents for 20 global cities (2016–2020) |


